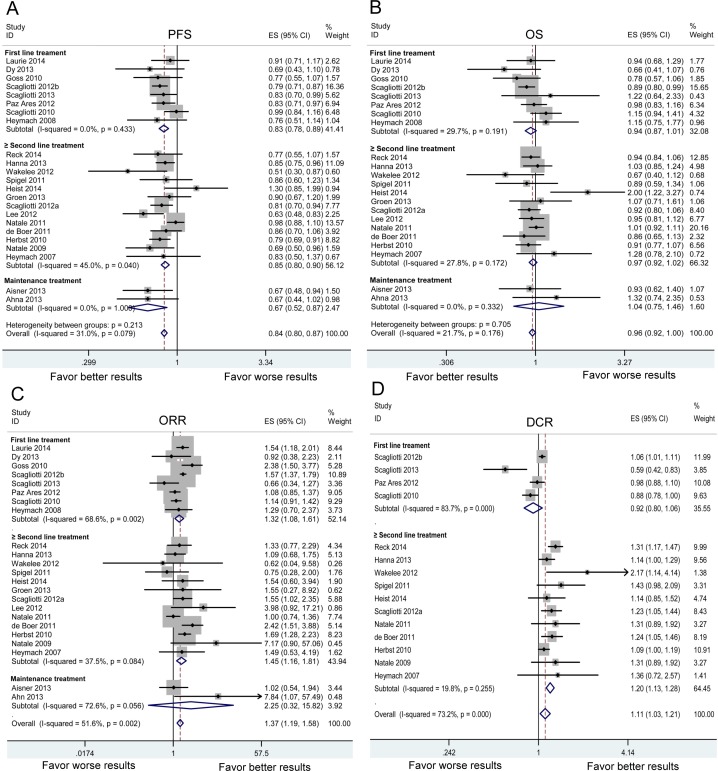
Figure 4. Subgroup analysis based on treatment line in advanced NSCLC patients in terms of progression-free survival (PFS) A. overall survival (OS) B. objective response rate (ORR) C. and disease control rate (DCR). D.
Squares indicate study-specific HR or RR (size of the square reflects the study-specific statistical weight); horizontal lines indicate 95% confidence interval (CI); diamond indicates the summary HR or RR estimate with its 95% CI.

