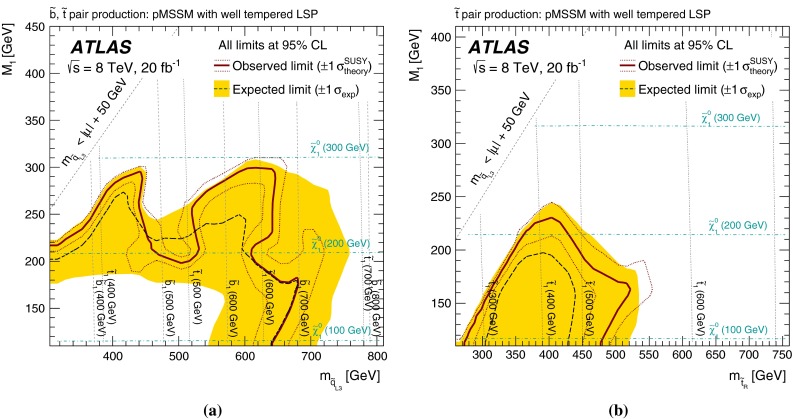
Fig. 14.

Expected and observed 95 % CL exclusion limits for the pMSSM model with well-tempered neutralinos as a function of and a or b . The limit of a is obtained as the combination of the t0L, t1L, tb and SS3L analyses, while the t0L analysis is used for b. The signal region yielding the smallest CL value for the signal-plus-background hypothesis is used for each point. The dashed black line indicates the expected limit, and the yellow band indicates the uncertainties, which include all uncertainties except the theoretical uncertainties in the signal. The red solid line indicates the observed limit, and the red dotted lines indicate the sensitivity to variations of the signal theoretical. The dashed and dotted grey lines indicate a constant value of the stop and sbottom masses, while the dashed light-blue line indicates a constant value of the neutralino mass
