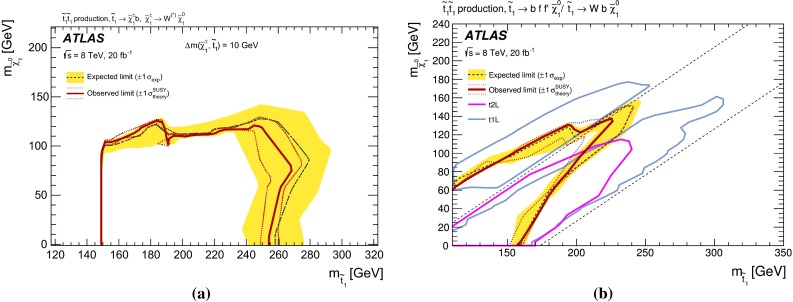
Fig. 19.

Exclusion limits at CL in the scenario where both pair-produced stop decay exclusively via a followed by , with , and b three-body or four-body decay (depending on the neutralino and stop mass). The black dashed line indicates the expected limit, and the yellow band indicates the uncertainties, which include all uncertainties except the theoretical uncertainties in the signal. The red solid line indicates the observed limit, and the red dotted lines indicate the sensitivity to variations of the signal theoretical uncertainties. For b, the observed limits achieved by the t1L and t2L analyses are also shown, and the straight dashed lines correspond to and
