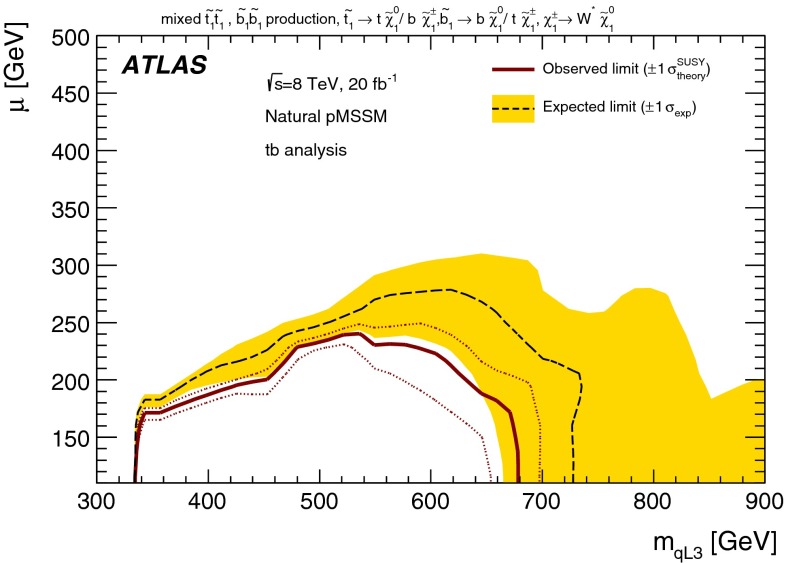
Fig. 23.
Exclusion limits at 95 % CL from the tb signal regions for the natural pMSSM model. The black dashed line indicates the expected limit, and the yellow band indicates the uncertainties, which include all uncertainties except the theoretical uncertainties in the signal. The red solid line indicates the observed limit, and the red dotted lines indicate the sensitivity to variations of the signal theoretical uncertainties. For each point the SR giving the best expected significance is used

