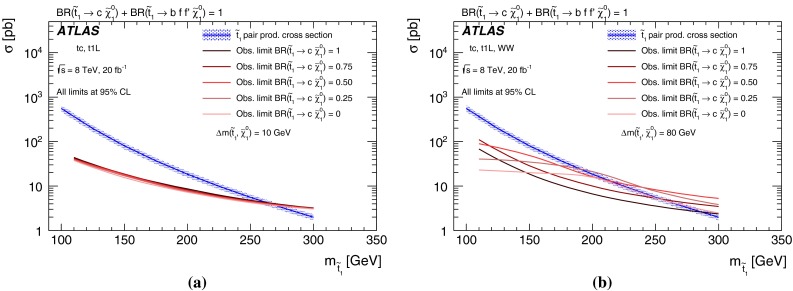
Fig. 5.

Upper limits on the stop pair production cross sections for different values of the BRs for the decays and . Signal points with of 10 GeV (a) and 80 GeV (b) are shown. The limits quoted are taken from the best performing, based on expected exclusion CL, signal regions from the tc-M, tc-C, t1L-bCa_low and WW analyses at each mass point. The blue line and corresponding hashed band correspond to the mean value and uncertainty on the production cross section of the stop as a function of its mass. The pink lines, whose darkness indicate the value of BR() according to the legend, indicate the observed limit on the production cross section
