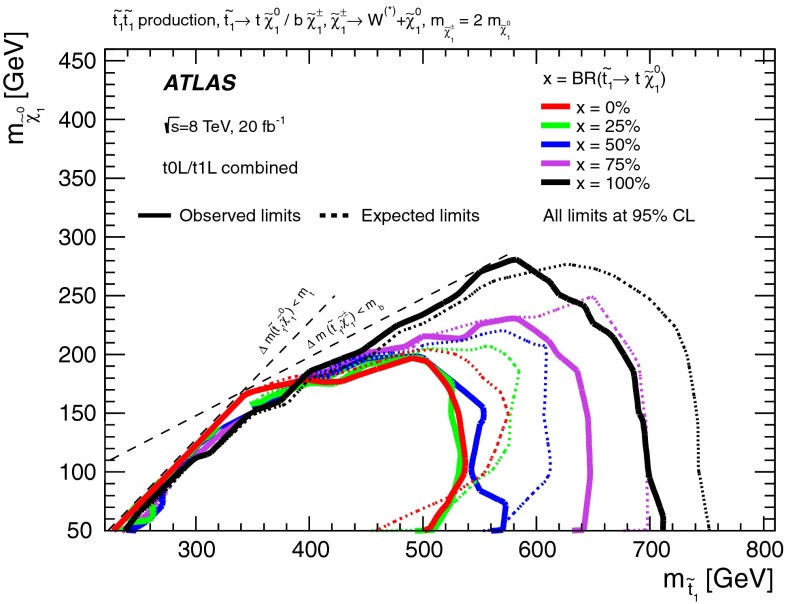
Fig. 6.
Combined exclusion limits assuming that the stop decays through with different branching ratios and through with branching ratios . The limits assume , and values of from to are considered. For each branching ratio, the observed (with solid lines) and expected (with dashed lines) limits are shown

