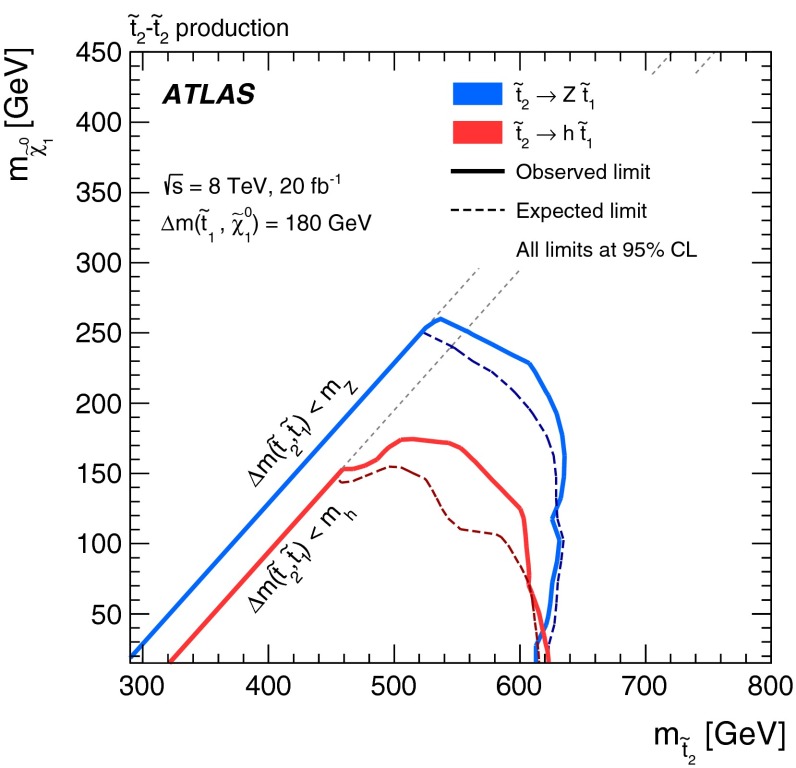
Fig. 9.
Exclusion limits at 95 % CL in the scenario where pair production is assumed, followed by the decay (blue) or (red) and then by with a branching ratio of 100 %, as a function of the and mass. The mass is determined by the relation GeV. The dashed lines indicate the expected limit and the solid lines indicate the observed limit

