
Figure 6. Downregulation of G3BP1 suppresses the mesenchymal phenotype of 4T1 cells.
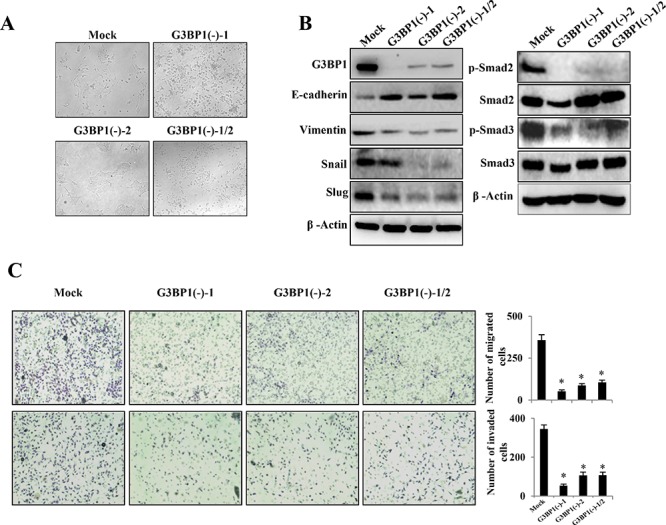
A. Morphological changes in 4T1-luc cell lines stably expressing mus-shG3BP1 (G3BP1(−)-1 or G3BP1(−)-2) or an empty vector (Mock) (magnification, × 100). B. Western blot of whole-cell extracts from 4T1 cells (Mock, G3BP1(−)-1, G3BP1(−)-2 or the mixture of these two clones (G3BP1(−)-1/2)) for epithelial and mesenchymal markers (left), phospho-Smad2 (p-Smad2), total Smad2 (Smad2), phospho-Smad3 (p-Smad3) and total Smad3 (Smad3) (right). β-actin was used as a loading control. C. Transwell migration assay (upper) and Matrigel invasion assay (lower) using 4T1 cells (Mock, G3BP1(−)-1, G3BP1(−)-2 or G3BP1(−)-1/2) (magnification, × 100). *P < 0.05 versus Mock. The data represent the means±s.d. of three independent experiments.