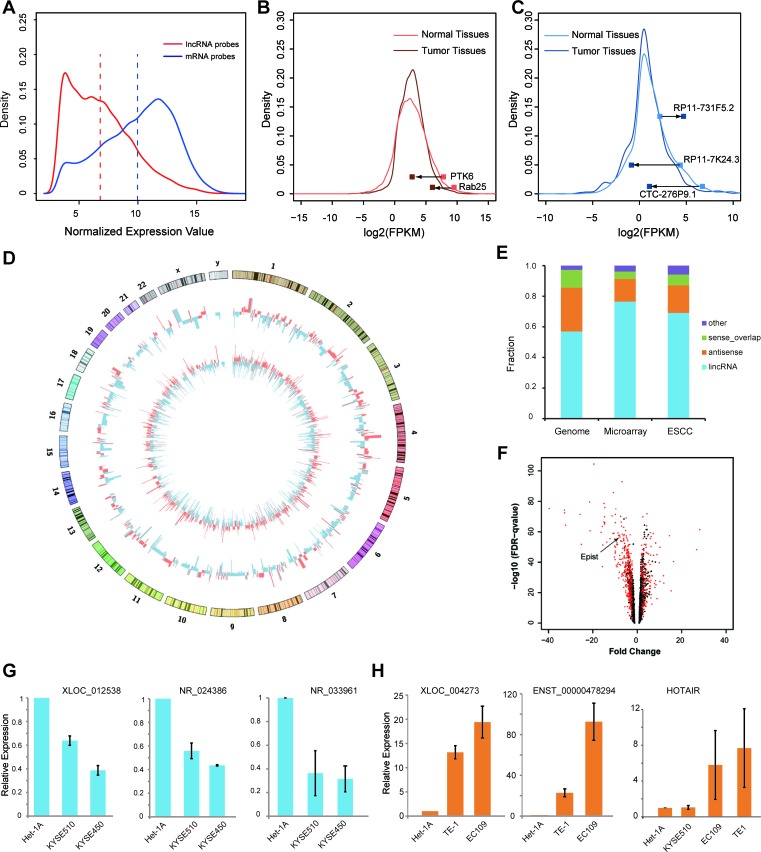
Figure 1. Transcriptome analysis of long noncoding RNAs in esophageal squamous cell carcinoma (ESCC).
A. Distribution of the expression levels of long noncoding RNAs (red) and protein-coding genes (blue) represented in the combined microarray. Dashed lines indicates the average value (6.799 for lncRNA and 9.963 for protein-coding genes). B., C. The density plot of the abundance of protein-coding genes B. and lncRNAs C. (log2-RPKM determined by Cufflinks) in the RNA-seq data. Several recently identified tumor suppressor genes (PTK6, Rab25) and lncRNAs that were differentially expressed between ESCC and adjacent normal tissues are indicated. D. The Circos plot showing genome-wide differential expression of long noncoding RNAs (930 probes) and mRNAs (3220 probes) between ESCCs and matched normal tissues. The outer and inner tracks indicate the lncRNAs and mRNAs, respectively (red, up-regulated; blue, down-regulated). The heights of the bars indicate fold differences. E. The barplot shows the biotype fraction of genome-scale, microarray assayed, differentially expressed lncRNAs (long intergenic noncoding RNA, Antisense, Sense_overlap and other biotypes). F. The volcano plot showing all the lncRNA probes assayed in the microarray and the differentially expressed lncRNAs (ESCALs) are indicated by the red dots. (The arrow suggests Epist). G., H. Quantitative RT-PCR analysis of several selected ESCALs in cell lines. G. Down-regulated ESCALs (XLOC_012538, NR_024386 and NR_033961); H. Up-regulated ESCALs (XLOC_004273, ENST00000478294 and HOTAIR). Het-1A is an immortalized normal esophageal epithelial cell line; TE-1, EC109, KYSE510 and KYSE450 are ESCC cell lines. Error bars, S.E.M.

