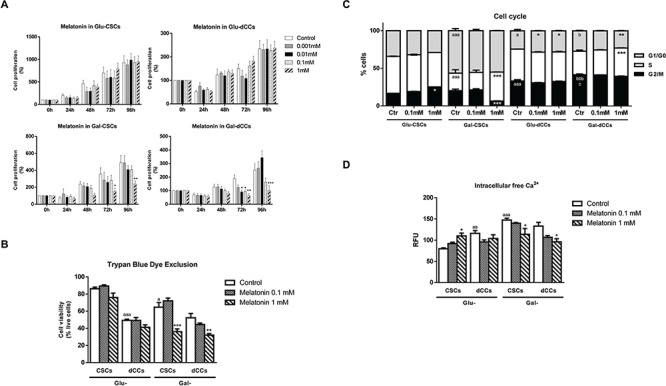
Figure 1. Melatonin showed antiproliferative effects only in P19 cells which were reliable in oxidative metabolism for ATP production.

Melatonin effects on cell viability were measured in the four types of P19 cells: stem (CSCs) and differentiated (dCCs) lines, growing in glucose (Glu) and in modified galactose (Gal)-containing media. A. The sulforhodamine B (SRB) assay shows a cytotoxic effect of 1mM melatonin in Gal-CSCs and Gal-dCCs. Data represent the average percentage of SRB absorbance with respective time 0 ± SEM from at least three independent experiments. *p < 0.05; **p < 0.01; ***p < 0.001 vs. control. B. Cell viability determined by trypan blue dye exclusion assay after 72 hours of treatment with melatonin confirms the resistance of P19 cells cultured in high glucose medium. Data are expressed as percentage of live cells ± SEM from at least three independent experiments. * vs. control; a vs. Glu-CSCs. C. Cell cycle was analyzed by flow cytometry using propidium iodide in the four types of P19 cancer cells, untreated (Ctr) and treated with melatonin (0.1 and 1 mM) during 72 hours. Data are expressed as percentage of cells in G1/G0, S and G2/M ± SEM from three independent experiments. D. Intracellular levels of free calcium were detected by Fluo-4 fluorescence. Data are means ± SEM from at least three separate experiments. Statistical comparisons: * vs. Ctr; a vs. Glu-CSCs; b vs. Gal-CSCs; c vs. Glu-dCCs. The number of symbols marks the level of statistical significance: one for p < 0.05, two for p < 0.01, and three for p < 0.001.
