
Figure 1. Expression of SNAI2 in normal and neoplastic prostate tissue.
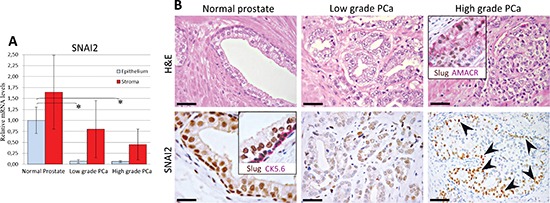
(A) SNAI2 mRNA expression in normal and cancerous prostate tissues from PCa patients. Histogram representing the relative expression ± SD of SNAI2 mRNA in microdissected histologically normal epithelium and stroma, and their neoplastic counterparts with low or high Gleason grades, from prostatectomized patients (groups of 15), normalized with the housekeeping gene HPRT. One-way ANOVA for comparisons between epithelial compartments of normal prostate, low- and high-grade PCa: p < 0.0001. *p < 0.01 Tukey HSD Test compared with normal prostate epithelium. (B) SNAI2 protein expression in normal and cancerous prostate tissues from PCa patients. Prostate tissue from PCa patients displayed a bright SNAI2 nuclear expression in both luminal and basal epithelial cell layer as confirmed by the double SNAI2(brown)/CK5.6(fuchsia) staining (inset in the bottom left panel). SNAI2 expression was frequently lost in malignant epithelium of PCa with either low or high Gleason grades. A strong SNAI2 expression was confined to neoplastic cells bordering high-grade PCa foci, as revealed by double SNAI2(brown)/AMACR(fuchsia) staining (inset in the upper right panel) and indicated by arrowheads in the single immunostained section (bottom right panel). Magnification: X630, bottom left panel; X200, bottom right panel; X400, the remaining panels. Scale bars: bottom left panel, 20 μm; bottom right panel, 50μm, the remaining panels, 30 μm.