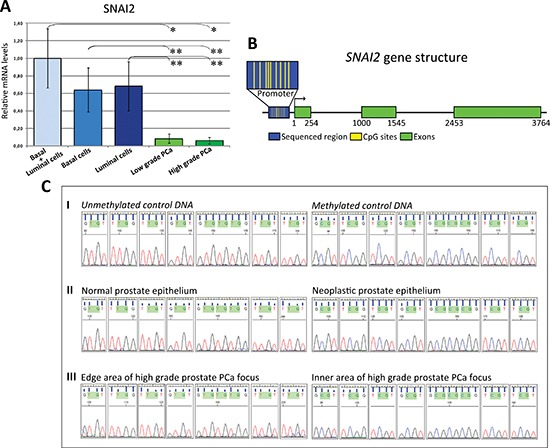
Figure 2. Expression of SNAI2 in normal prostate epithelium and bisulfite genomic sequencing of the proximal promoter region of the SNAI2 gene.

(A) SNAI2 mRNA expression in the basal and luminal epithelial cells of normal prostate glands. Histogram representing the relative expression ± SD of SNAI2 mRNA in microdissected histologically normal basal and luminal secretory epithelium (15 randomly chosen normal samples from PCa patients) and neoplastic epithelium from low and high-grade PCa. One-way ANOVA for comparisons between normal basal and luminal secretory epithelium and neoplastic epithelium from low and high-grade PCa: p < 0.0001. *p < 0.01 Tukey HSD Test compared with low or high-grade PCa. **p < 0.05 Tukey HSD Test compared with low or high-grade PCa. (B) DNA methylation status of SNAI2 gene promoter in PCa. The SNA12 gene promoter (blue box) contains 9 sparsely spaced CpG islands (small yellow bars) in its central portion. (C) Genomic sequencing of the proximal promoter region located 130 bases upstream from the TSS of the SNAI2 gene in microdissected normal and cancerous prostate epithelium, or microdissected cells from the inner and edge areas of high-grade PCa foci. I. The electropherogram shows the methylation status of each CpG island in control DNA where TG represents the unmethylated site (top left), and CG represents the methylated site (top right). II. CpGs were unmethylated in normal prostate epithelium (middle left) and methylated in neoplastic prostate epithelium (middle right). III. CpGs were unmethylated in cell clusters from the edge area (bottom left), and methylated in cell clusters from the inner area of the high-grade PCa focus (bottom right).
