
Figure 3. Immunohistochemical features of low- and high-grade foci in the primary PCa.
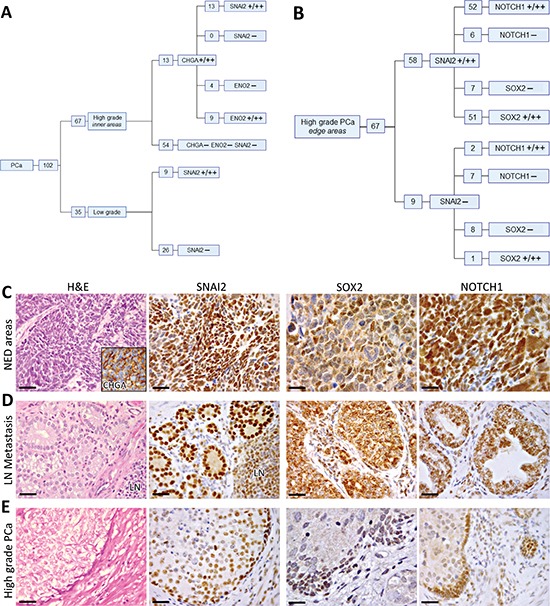
(A) Distribution of SNAI2, CHGA and ENO2 expression in low-grade PCa, and in the inner areas of high-grade PCa. A total positive correlation was disclosed by Spearman's rank correlation coefficient between the expression of SNAI2 and CHGA in clinical high-grade PCa samples, whereas a high correlation was detected between SNAI2 and ENO2 expression (ρ = 0.8, p < 0.0001). (B) Distribution of SNAI2, NOTCH1 and SOX2 expression at the edge of high-grade PCa. A positive relationship was disclosed, by Spearman's rank correlation coefficient, between the expression of SNAI2 and that of SOX2 (ρ = 0.63, p < 0.0001) and NOTCH1 (ρ = 0.58, p < 0.0001). (C) Immunohistochemical features of NED areas developed in conventional adenocarcinomas. Cancer cell nests forming CHGA+ (inset) NED areas firmly express SNAI2 (magnification X400) and SOX2, frequently NOTCH1 (magnification X630), with a distinct to strong staining. Scale bars: H&E and SNAI2 staining, 30 μm; SOX2 and NOTCH1 staining, 20 μm. (D) Immunohistochemical features of lymph node metastases. Lymph node (LN) metastases frequently express SNAI2, SOX2 and NOTCH1, with a distinct to strong staining. Magnification X400. Scale bars: 30 μm. (E) Immunohistochemical features of high-grade PCa foci. Cancer cell clusters at the edge of high-grade PCa frequently express SNAI2, SOX2, and NOTCH1. Magnification X400. Scale bars: 30 μm.