
Figure 7. SOX2 and NOTCH1 mRNA expression in normal and cancerous prostate epithelium from PCa patients.
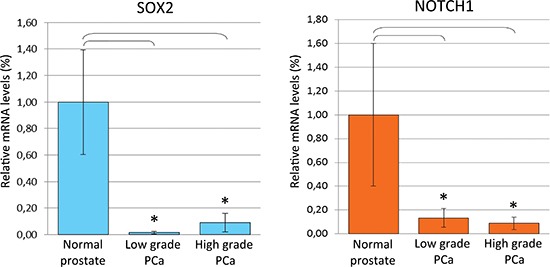
(A) Histogram representing the relative expression ± SD of SOX2 mRNA in microdissected histologically normal epithelium and its neoplastic counterparts with low or high Gleason grades, from prostatectomized patients (groups of 15), normalized with the housekeeping gene HPRT. One-way ANOVA for comparisons between epithelial compartments of normal prostate, low- and high-grade PCa: p < 0.0001. *p < 0.01 Tukey HSD Test compared with normal prostate epithelium. (B) Histogram representing the relative expression ± SD of NOTCH1 mRNA in microdissected histologically normal epithelium and its neoplastic counterparts with low or high Gleason grades, from prostatectomized patients (groups of 15), normalized with the housekeeping gene HPRT. One-way ANOVA for comparisons between epithelial compartments of normal prostate, low- and high-grade PCa: p < 0.0001. *p < 0.01 Tukey HSD Test compared with normal prostate epithelium.