
Figure 3. Morphology of DCs detected by scanning electron microscopy (SEM) and transmission electron microscopy (TEM).
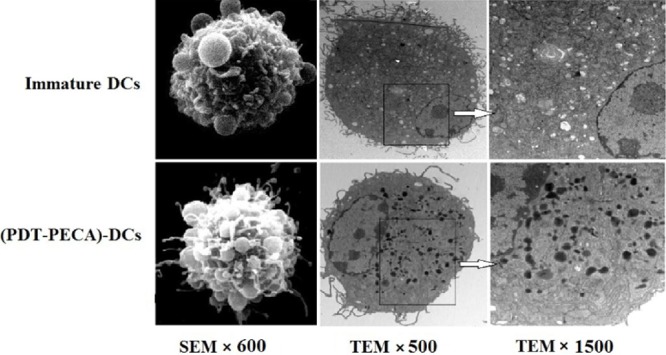
Top Panel: SEM and TEM images of immature DCs. Bottom Panel: SEM and TEM images of DCs after stimilation by PDT-treated PECA cells. PECA cells were treated by PDT (0.5 mM ALA, 0.5 J/cm2). Six hours after PDT treatment, PECA cells were incubated with imDCs for 24 h. Then DCs were visualised by SEM (left column, ×600), TEM (×500) (middle column) and TEM (×1500) (right column). The enlargement of dendrites and increase of lysosomes were clearly seen in DCs after stimulation by PDT-treated PECA cells.