
Figure 1. siRNA kinome screens identified PAPSS1 as a target that can be silenced to improve cisplatin activity.
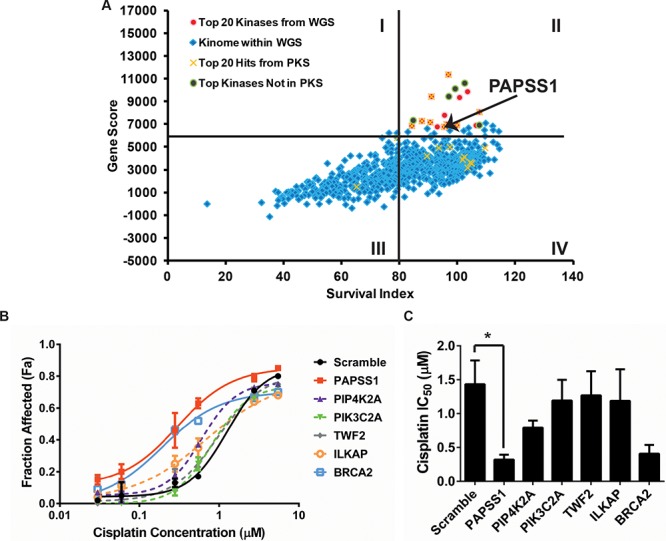
The results from the kinome screen are summarized in A. where each data point represents one gene being silenced in the presence or absence of cisplatin. The x-axis indicates cell viability under gene-silencing condition in the absence of cisplatin. The Gene Score on the y-axis is calculated as the product of survival index (cell viability from gene knockdown alone) and potentiation effects (the difference in cell count in the absence versus the presence of cisplatin when the gene is silenced). Cisplatin dose response curves (72 h treatment) were generated to further evaluate the top five targets B. The data is plotted as fraction affected (mean ± SD) where a Fa value of 0 would indicate equivalent viable cell count in the treated well relative untreated controls. The IC50 values interpolated from these fitted curves (mean ± 95% confidence intervals) are displayed in C. PAPSS1 silencing caused the most reduction in IC50 relative to scramble (*p < 0.05) and improved cisplatin response to an equal or a greater extent compared to BRCA2 silencing.