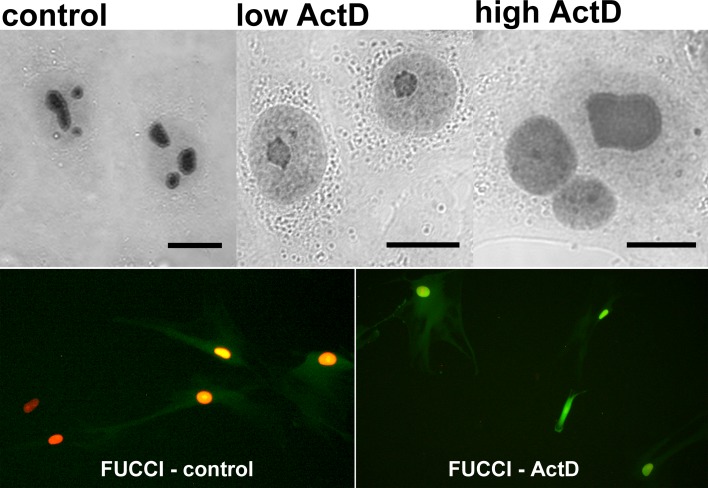
Figure 6. Correlation of ActD-stimulated changes of PGAM localization in NSCLC cells with blockade of the cell cycle cell in G2 phase.
Upper panel: the PGAM2 localization in the cells incubated with 0.04 μg/ml (low) or 2.5 μg/ml (high) actinomycin D (ActD). Lower panel: the cells in G1 (red) and G1/S (yellow) phase in control conditions and blockade of the ActD-treated cells in G2 phase (green fluorescence) as determined by FUCCI Cell Cycle Sensor. Bar=10 μm.

