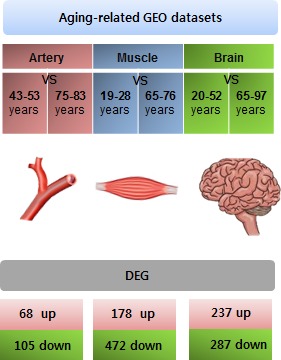
Figure 1. Collection of aging-related gene expression signatures from the artery, muscle, and brain.

Schematic to explain the overall experimental process. To reveal more significant aging-related gene expression, we rearranged the subjects and excluded individuals who were middle-aged. The GEO dataset GSE16487 was used to analyze differentially expressed genes (DEGs) in the aging artery (younger: n = 6, older: n = 7). GSE38718 was used to analyze genes related to the aging muscle (younger: n = 7, older: n = 4) GSE11882 was used to analyze DEGs in the aging brain (younger: n = 12, older: n = 11). DEGs were analyzed by comparing expression between young and older subjects. The DEGs were sorted using GE2R.
