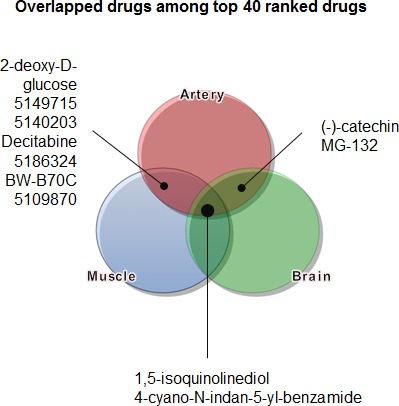
Figure 3. Identification of candidate agents to overcome aging using a connectivity map.

The DEGs deduced from Figure 2 were used as an input list to apply to a connectivity map. Candidate agents that were common to several tissues were expressed in a Venn diagram.
