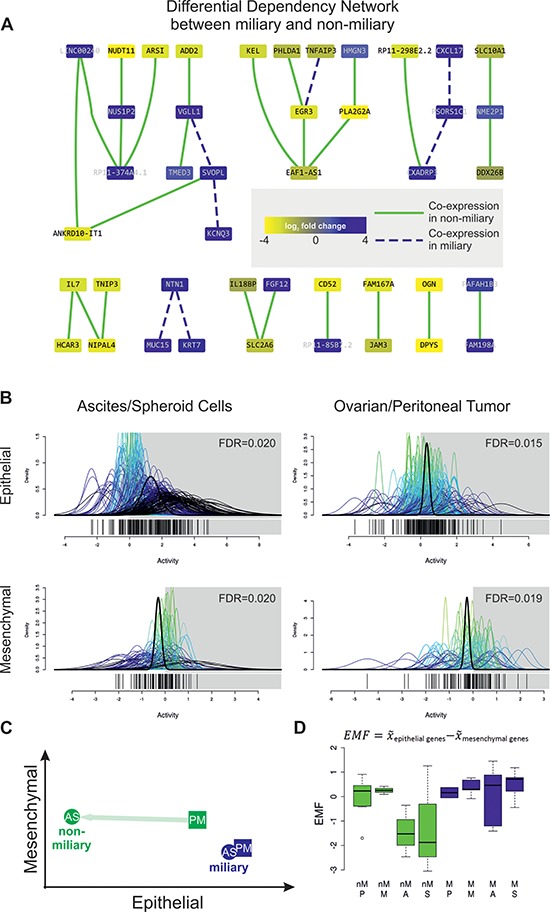
Figure 2.

A. Differential Dependency Network (DDN) between miliary and non-miliary samples constructed from the 90 significantly differentially expressed genes between both tumor spread types. Colors of nodes represent log2 fold changes between both conditions (blue, up in miliary). Green solid and blue dashed edges indicate significantly different connections, defined by co-expression in samples of the respective type, miliary and non-miliary. B. Quantitative set analysis using an epithelial and a mesenchymal gene signature [16] and ascites single tumor cells or spheroids (A/S, left) and ovarian or peritoneal solid tumor masses (P/M, right) from patients with miliary tumor spread compared to patients with non-miliary tumor spread (QuSAGE). The x-axis (“Activity”) represents probability density functions (pdf) for every fold-change between the corresponding comparison of every gene in the gene-set (colored) and a combined probability density function over all genes in the gene set (bold black). A pdf around 0 indicates no change in the activity of the gene set in the corresponding comparison. C. Scheme depicting epithelial and mesenchymal characteristics of tumor cells, according to the calculated EMF. D. Boxplot showing the epithelial-mesenchymal factor for non-miliary (nM, green) and miliary (M, blue) samples of the different tissue origins. EMF is calculated as median expression () of epithelial genes minus median expression () of mesenchymal genes and is interpreted as relative differences between samples.
