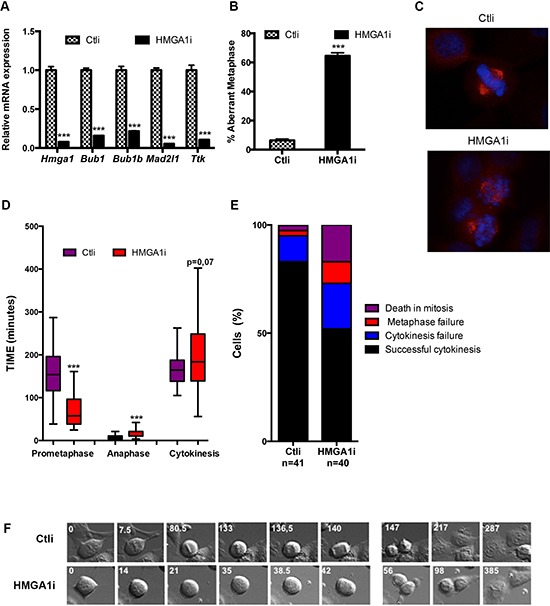
Figure 3. HMGA1 depletion impairs the mitotic checkpoint.

A. Control (Ctli) and HMGA1-depleted (HMGA1i) HeLa cells were tested for the expression of HMGA1 and SAC genes by qPCR. B. HeLa cells were transfected with Ctli and HMGAi siRNA as in A, fixed 48 hrs post transfection and stained with DAPI (blue) and anti-β-tubulin Ab (red) to identify the DNA and the mitotic spindle, respectively. About 150 metaphases per sample were scored for the presence of aligned chromosome. The data are represented as mean ± SD. Differences between Ctli and HMGA1i are statistically significant. ***p < 0.001, Student's t-test. C. Representative immunostainings are shown (right). D. HeLa cells treated as in A and analyzed 48 h post transfection by time lapse video. For each case, duration of the different phases of the mitosis and of the cytokinesis was measured. The duration of the indicated mitotic phases is reported in box plot graph (Whisker diagram). ***p < 0.001, Student's t-test. E. The percentage of cells with the indicated outcome is reported. F. Still images related to Supplementary Movies S1 and S2. See also Supplementary Figure S3.
