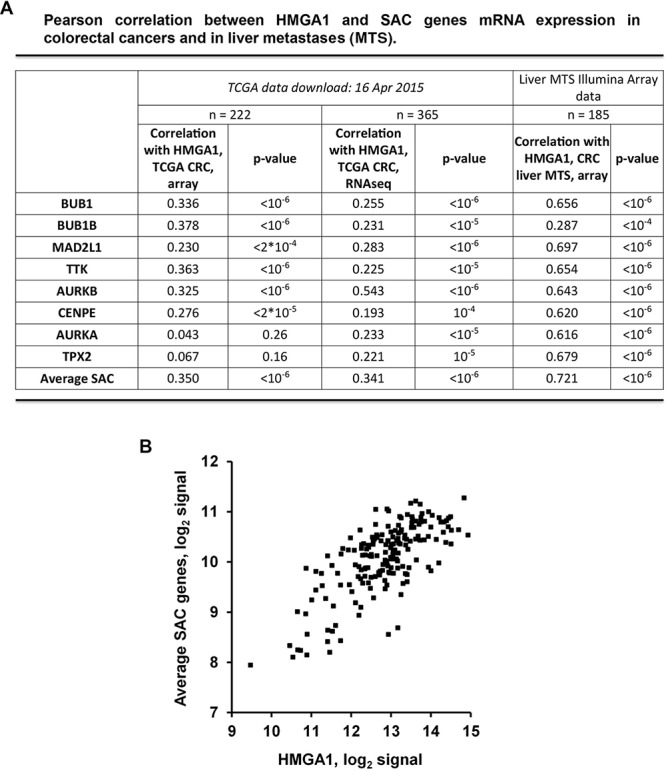
Figure 4. HMGA1 and SAC genes expression correlates in colorectal cancer samples and in liver metastases.

A. Correlation between the expression of HMGA1 and of the SAC genes BUB1, BUB1B, MAD2L1, TTK, AURKB, CENPE, AURKA and TPX2 in global mRNA profiles of colorectal cancer and liver metastases (MTS). 365 and 222 clorectal carcinoma samples were profiled by The Cancer Genome Atlas (TCGA; http://cancergenome.nih.gov/) with, respectively, RNAseq and DNA microarrays. 185 liver MTS samples were profiled with Illumina array. B. Dot-plot depicting the correlation between HMGA1 and average SAC genes in liver MTS.
