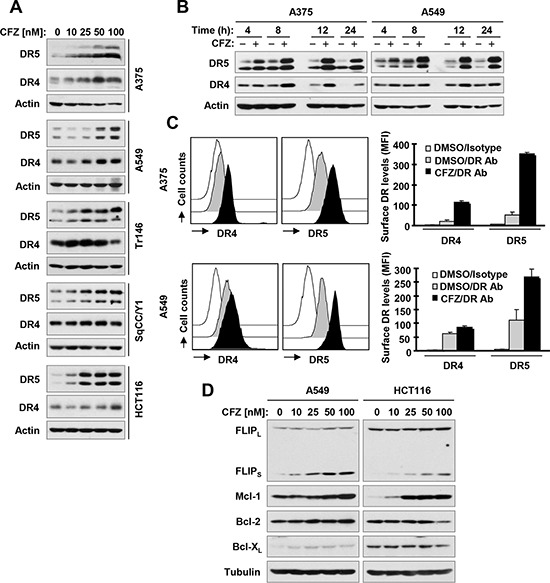
Figure 3. CFZ increases total (A and B) and cell surface (C) levels of DR5 and DR4 accompanied with elevated c-FLIP and Mcl-1 (D).

A, B and D, The indicated cell lines were treated with the given concentrations of CFZ for 8 h (A and D) or with 100 nM CFZ for different times (B) and then subjected to preparation of whole-cell protein lysates. The given proteins were detected using Western blot analysis. C, The indicated cell lines were treated with 100 nM CFZ for 15 h and then harvested for analysis of cell surface DR5 and DR4 by immunofluorescence staining and subsequent flow cytometry. The open peak represents DMSO-treated cells stained with a matched control PE-conjugated IgG isotype antibody. The filled grey peaks show DMSO-treated cells stained with PE-conjugated anti-DR5 or DR4 antibody. The filled black peaks represent CFZ-treated cells stained with PE-conjugated anti-DR5 or DR4 antibody.
