
Figure 2. Copy number analysis.
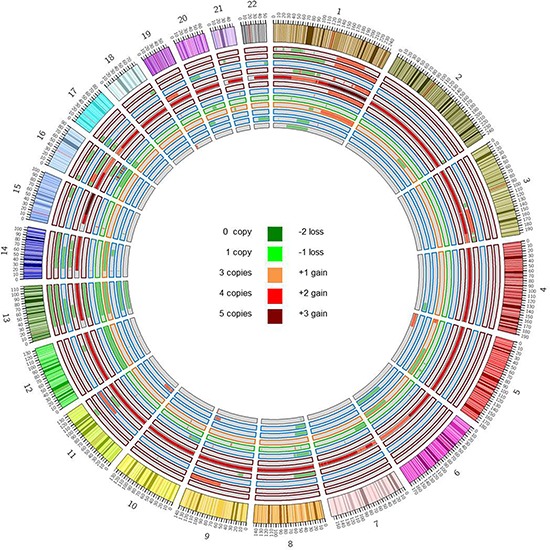
Copy number alterations were identified starting from WES data by using EXCAVATOR software. The Circos plot represents somatic amplifications (red) and deletions (green) found in each case, distributed across all chromosomes. Samples are displayed according to increasing case number from outer to inner track. Colors of track borders indicate translocation groups: t(14;16) in red, t(11;14) in blue, t(14;20) in green, t(4;14) in orange. PCL-020 resulted as outlier with the greatest number of CNAs and a basal tetraploidy with regions till to five copies.