
Figure 5. Hierarchical clustering of the 55 MM-21pPCL-4N dataset based on the expression levels of the 132 most variable and mutated genes.
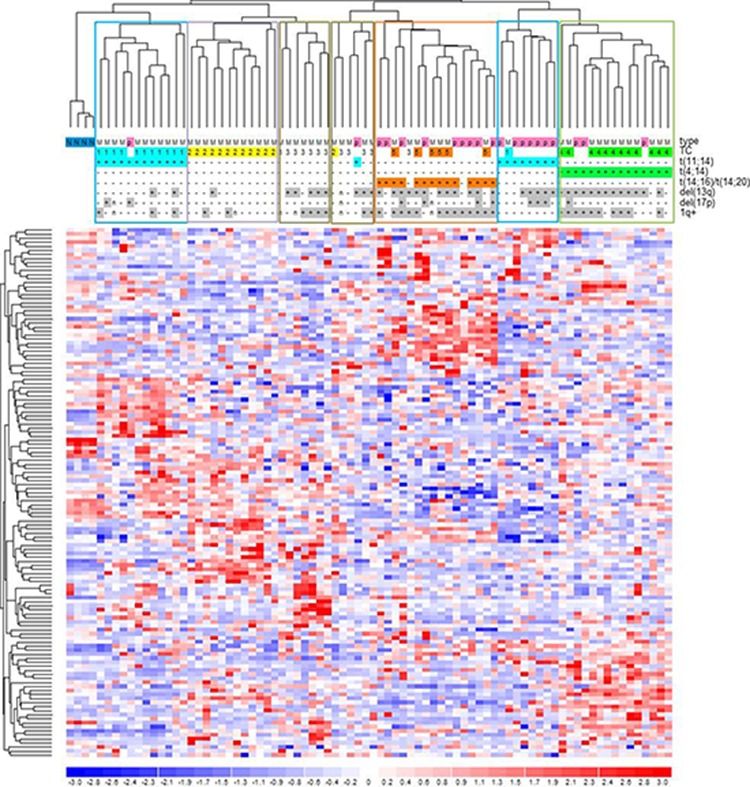
Data were previously generated on GeneChip Human Gene 1.0 ST array platform [12]. Samples were labelled according to tumor type (MM, multiple myeloma; p, primary plasma cell leukemia), translocation/cyclin D (TC) classification and the main associated cytogenetic alterations. Significant sample clusters, according to major IgH translocations, are highlighted.