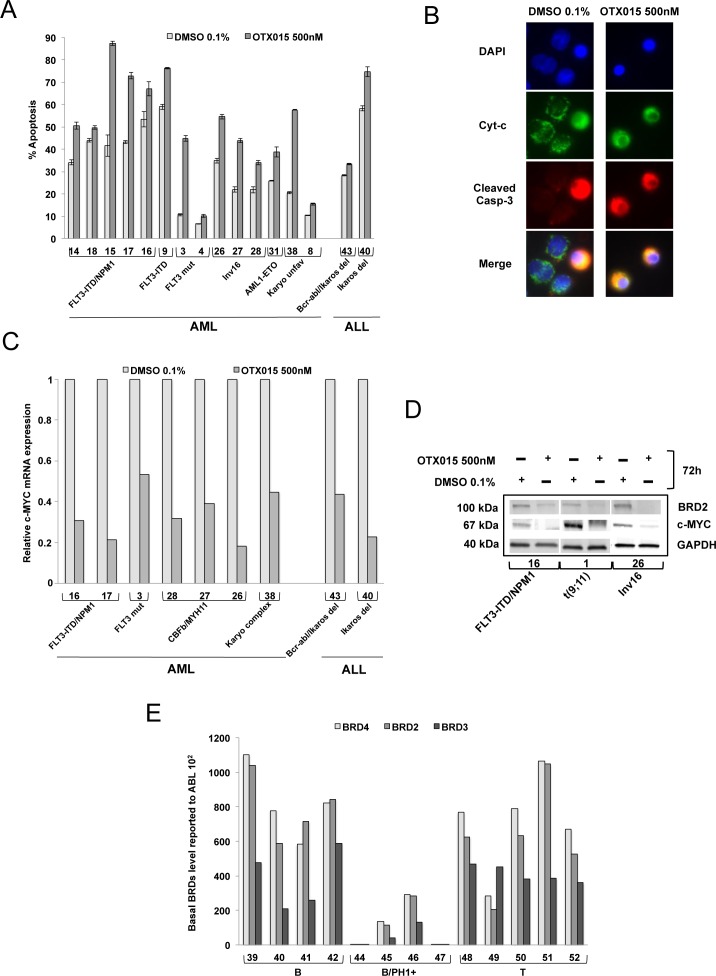
Figure 4. Induction of apoptosis, expression of c-MYC and BRD2 following OTX015, and basal expression of BRD2/3/4 in AML and ALL patient samples.
A. Bone marrow mononuclear cells were exposed to 500nM OTX015 for 72h. Apoptotic cells were defined as Annexin V+ with or without PI uptake. Results are shown as mean +/− SEM. B. BM cells from a patient with MLL-rearranged AML (MLL-AF9) (Patient 1, Table 2) showing cytochrome c (green), activated caspase-3 (red) and nuclei (blue). In non-apoptotic cells cytochrome c (green) shows dotted staining localized in the mitochondria while no activated caspase-3 could be detected, and in apoptotic cells cytochrome c is released into the cytosol (green) and activated caspase-3 is localized to the cytoplasm (red). Merged images of apoptotic cells appear in yellow. C. RT-qPCR showing c-MYC mRNA expression in nine AML and ALL patient samples after 72h exposure with 500nM OTX015 or 0.1% DMSO, relative to ABL normalized to 0.1% DMSO. D. Western blot showing BRD2, c-MYC and GAPDH expression in three AML patient samples exposed 72h to 500nM OTX015 or 0.1% DMSO ex vivo. E. RT-qPCR showing BRD4, BRD2, and BRD3 basal gene expression levels in 13 ALL patient samples, relative to ABL 102.

