
Figure 2. Overview of BLBC network modules.
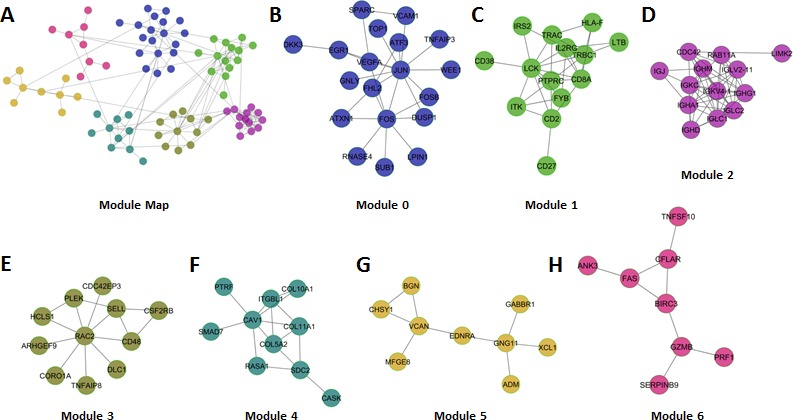
A. Global view of the 7 network modules (circles represent nodes (Genes) and gray lines represent edges). B-H. Each of the individual modules is presented.
Official websites use .gov
A
.gov website belongs to an official
government organization in the United States.
Secure .gov websites use HTTPS
A lock (
) or https:// means you've safely
connected to the .gov website. Share sensitive
information only on official, secure websites.
A. Global view of the 7 network modules (circles represent nodes (Genes) and gray lines represent edges). B-H. Each of the individual modules is presented.