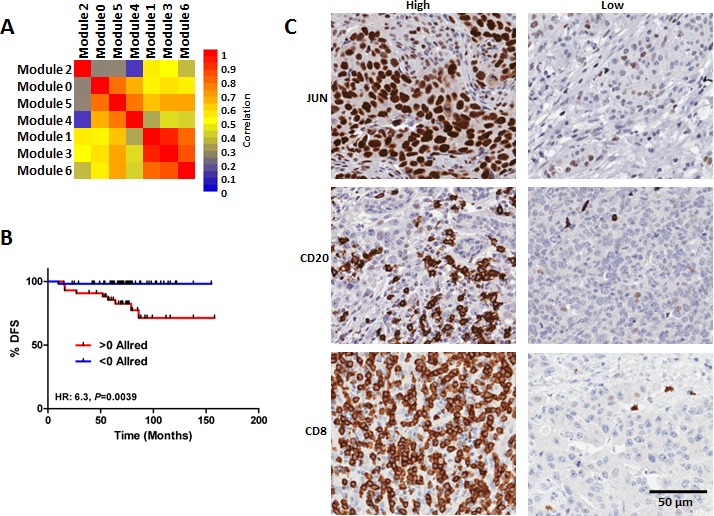
Figure 4. Validation of the BLBC network modules using and IHC TMA based approach.

A. Correlation of the module indices reveal relationship between modules 0, 4 & 5, modules 1, 3 & 6, respectively, as well as no relationship between module 2 and any other module. B. Survival analysis of the patients comprising the BLBC TMA stratified based on staining for JUN, CD8 and CD20. C) Representative photographs of high and low expression tumors for JUN, CD8 and CD20.
