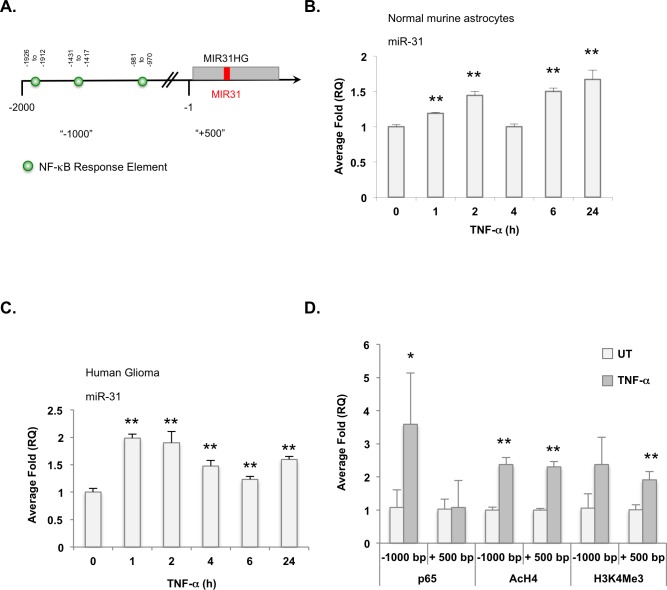
Figure 5. TNF-α activated NF-κB induces miR-31 expression.
A. Diagram of the MIR31HG promoter and putative NF-κB response elements. Positions marked are relative to transcriptional start site. B., C. Normal murine astrocytes B. or U251-MG cells C. were stimulated with TNF-α (10 ng/ml) for the times indicated and miR-31 levels evaluated by qRT-PCR. (**, p < 0.005). D. U251-MG cells were left untreated (UT) or stimulated with TNF-α (10 ng/ml) for 4 h, and ChIP analyses were performed using the antibodies specified. Primers targeting regions upstream (“-1000”) and downstream of the TSS (“+500”) were used. (*, p < 0.05; **, p < 0.005).

