
Figure 6.
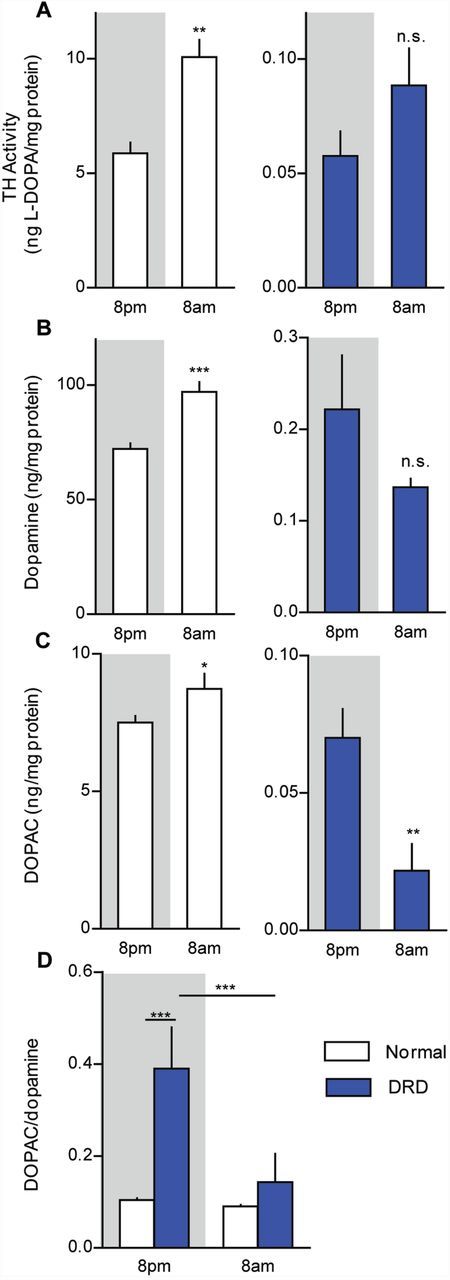
Diurnal fluctuations in dopamine metabolism. (A) Striatal TH activity was assessed in the early active period (8 pm) and early inactive period (8 am) in normal and DRD mice (n = 5–8/condition). There was a significant genotype × time interaction effect [F(1,21) = 25.8, P < 0.001], with normal mice exhibiting significantly more TH activity at 8 am than at 8 pm (P < 0.01) but no significant difference was observed between times of day in DRD mice (P > 0.1). (B) Striatal dopamine and (C) DOPAC concentrations, as well as (D) the DOPAC/dopamine ratio were assessed at 8 am and 8 pm (n = 6–9/condition). (B) For dopamine, there was a significant genotype × time interaction effect [F(1,23) = 23.6, P < 0.001], with the concentration of dopamine in normal mice significantly greater at 8 am than at 8 pm (P < 0.01) but no significant difference observed between times of day in DRD mice. (C) For DOPAC, there was a significant genotype × time interaction effect [F(1,23 = 4.6, P < 0.05], with the concentration of DOPAC in normal mice significantly greater at 8 am than at 8 pm (P < 0.05) but DOPAC was significantly lower at 8 am than at 8 pm in DRD mice (P < 0.01). (D) Similarly, for the DOPAC/dopamine ratio, there was a significant genotype × time interaction effect [F(1,23) = 12.6, P < 0.01] with significantly greater dopamine turnover at 8 pm than at 8 am in DRD mice (P < 0.001), but not normal mice. Statistical analyses were performed using a two-way ANOVA with Student’s t-test post hoc analyses for TH activity, dopamine and DOPAC concentrations, and Holm-Sidak post hoc analysis for turnover values. Values represent mean ± SEM; *P < 0.05, **P < 0.01, ***P < 0.001.