
Fig. 9.
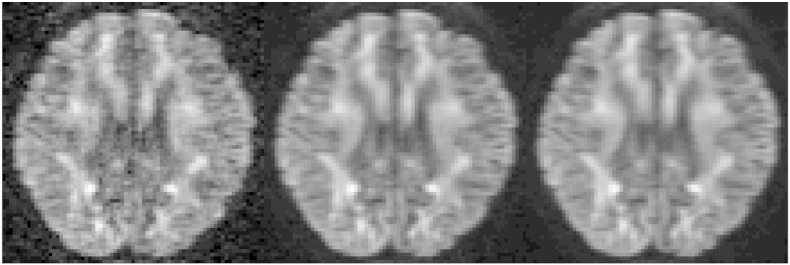
Examples of observed and predicted images for the single shell model. The left panel shows an image acquired with a b-value of 3000 and the diffusion gradient [1 0 0], the middle panel shows the Gaussian process prediction when the observed image was part of the training data (smoothing) and the right panel when the observed image was not (interpolation).