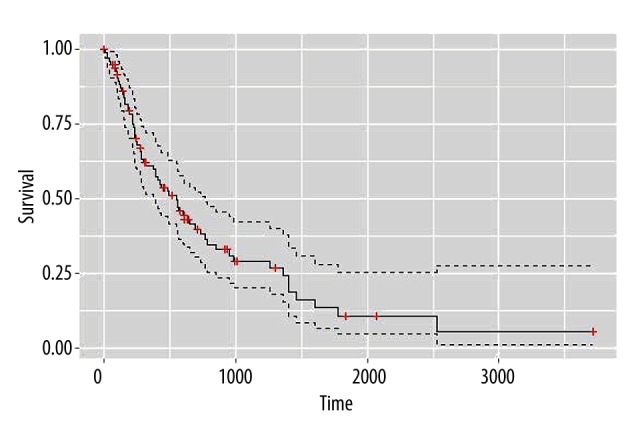
Figure 2.

Overall survival status changes of patients. The survival curves were drawn according to patient survival time. The vertical axis shows survival time and the horizontal axis shows survival rates, the red crosses on the curve are cut-off values. As seen from the figure, patient viability decreased gradually over time.
