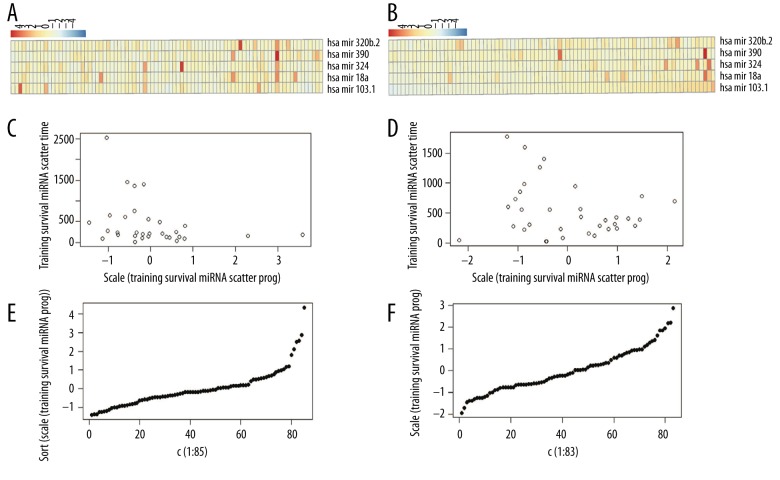
Figure 6.
Analysis of the risk coefficients predicted by the 5 miRNAs. (A) Risk coefficients analysis of training set data; (B) Heat map for expression levels of 5 miRNAs in training set; (C, D) Relationship between patient survival time and risk coefficients; (E, F) Distribution of risk coefficients.

