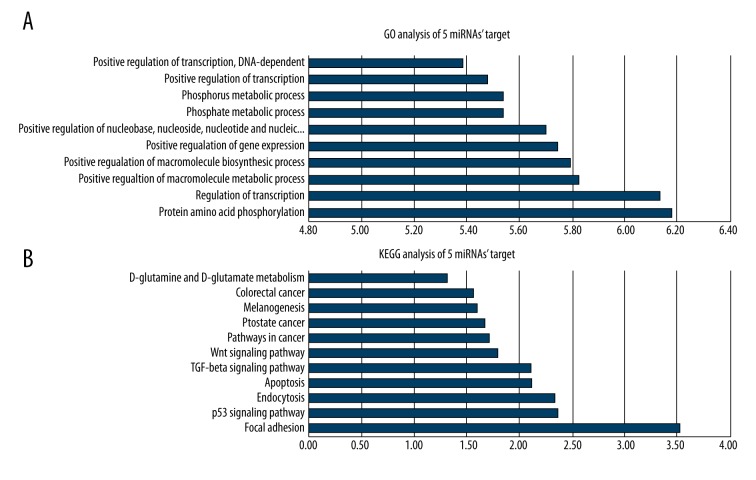
Figure 7.
GO and KEGG analysis of the target genes of differentially expressed miRNAs. (A) GO analysis of the target gene; (B) KEGG analysis of the target gene. The abscissa represents degree of significance, while the vertical axis represents functional annotation; the greater the degree of significance, the greater the correlation between the target gene and annotation.

