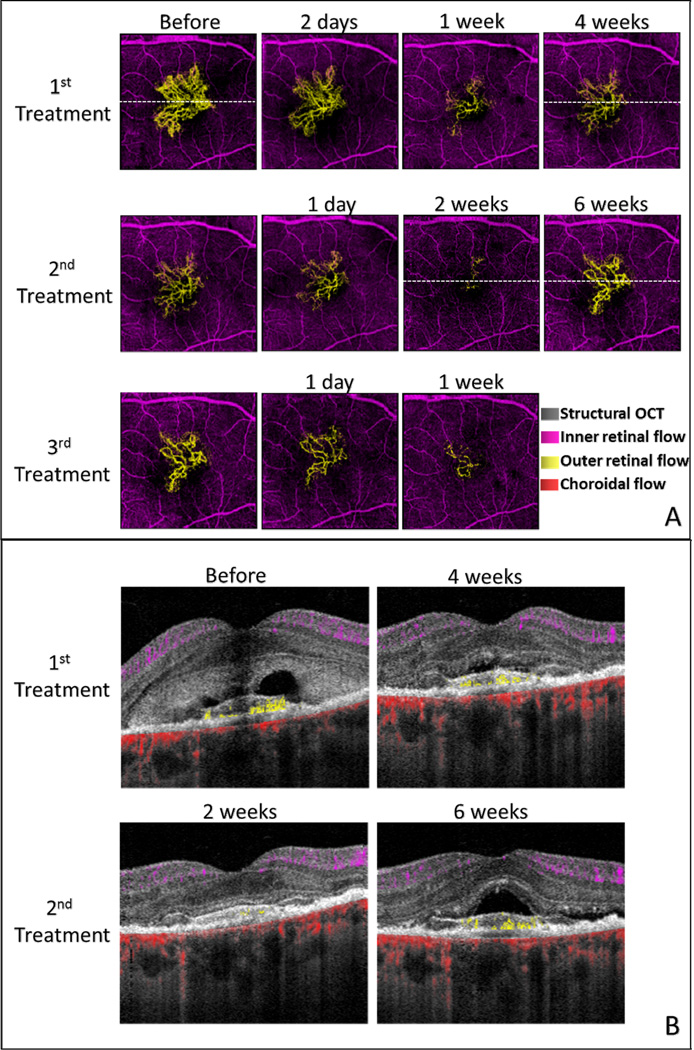
Figure 1.
Optical coherence tomography (OCT) angiography (3×3 mm) of choroidal neovascularization (CNV). (A) En face OCT angiograms showing time course of CNV response to anti-angiogenic treatment over 3 cycles. The dash lines indicate the locations of cross sections below. (B) Cross-sectional OCT angiography showing sub-retinal fluid and CNV flow simultaneously at selected time points. CNV is above the retinal pigment epithelium indicating Type II CNV. By 4 weeks after the initial injection, sub-retinal fluid had largely been resorbed but flow in CNV was again active. Two weeks after the second injection, CNV flow had nearly ceased and the retina appeared completely dry. Six weeks after the second injection, there was a return of both CNV flow and sub-retinal fluid. The color code is: inner retinal blood flow between the inner limiting membrane and outer plexiform layer – purple; outer retinal blood flow (CNV) between the outer plexiform layer and retinal pigment epithelium (RPE) – yellow; choroidal blood flow - red. Flow projection artifact in the RPE had been removed using a post-processing algorithm.

