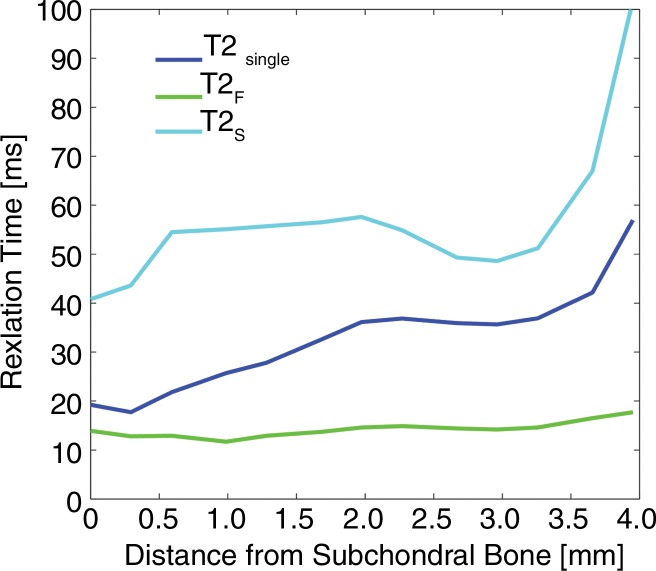
Figure 2a:
Line graphs show pixel-by-pixel measurements of (a) T2Single, T2F, and T2S and (b) FF plotted along linear region of interest extending from cartilage-bone interface to articular surface on single sagittal section through patellar cartilage in randomly chosen 27-year-old asymptomatic male volunteer. Note depth-dependent variations in single component and multicomponent T2 parameters.

