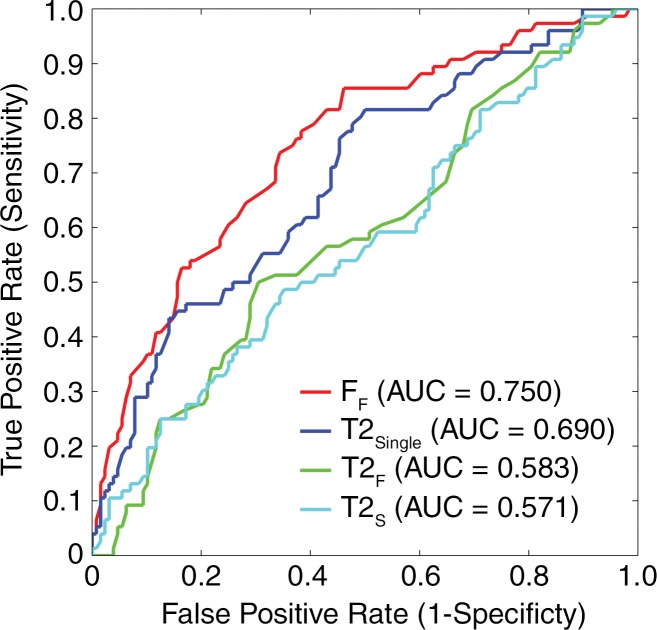
Figure 5b:
Receiver operating characteristic curves with AUCs showing diagnostic performance with average T2Single, T2F, T2S, and FF values in each cartilage subsection to differentiate between (a) morphologically normal cartilage and cartilage with morphologic degeneration and between (b) morphologically normal cartilage and cartilage with mild morphologic degeneration. FF showed significantly higher (P < .05) AUC values than did other single-component and multicomponent T2 parameters, indicating greater diagnostic performance.

