
Fig. 2.
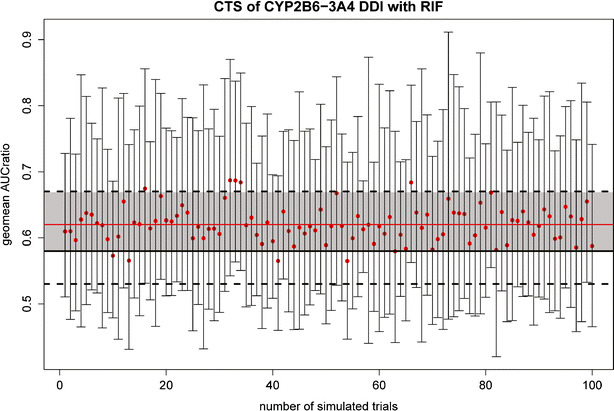
DDI clinical trial simulation of tramadol and rifampicin to assess the CYP2B6-3A4 contribution. The figure depicts the results of 100 trial simulations mimicking the original trial, when CYP2B6-3A4 contributions are assumed to be 10–42%, respectively. Black horizontal lines represent the in vivo observed ratio of AUC geo means (solid) and 90% confidence limits (dashed). The solid red line represents the average ratio of simulated AUC geo means. Since the solid black line still is in the 90% confidence region (grayed area) of the simulated ratio, we assume that CYP2B6 contribution should be between 0 and 10%