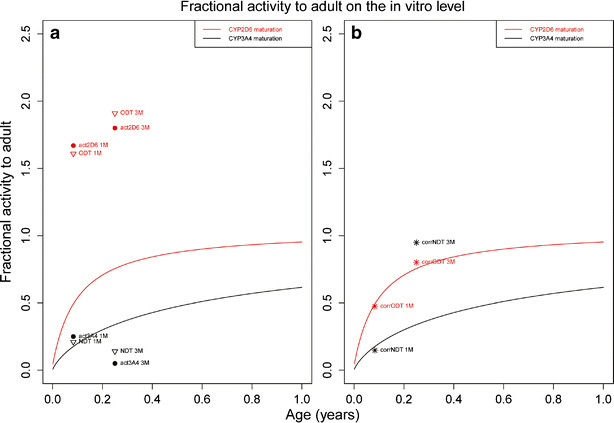
Fig. 3.

Theoretical maturation of CYP2D6 (17) (red line) and CYP3A4 (18) (black line) expressed as fractional activity versus age. In the left plot, ODT/NDT activity (solid dots) for two pediatric HLM batches (1 and 3 months) are depicted together with the activity of probes (open triangles) DEX (act2D6) and MDZ (act3A4). In the right plot, the ratio of each corresponding pair is taken as described in the body text and indicated as corrODT and corrNDT. ODT formation follows the CYP2D6 maturation profile, while NDT formation does not follow the CYP3A4 maturation profile
