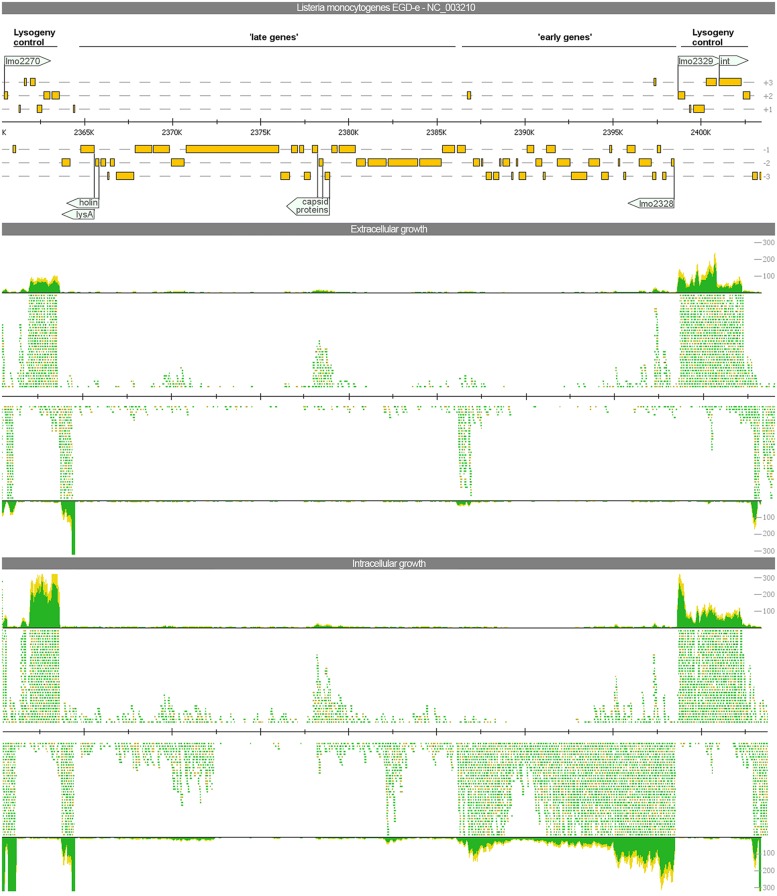
FIGURE 3.
Visualization of the gene expression profiles of the A118-like prophage locus (lmo2271–2332) under extra- and intracellular growth condition. The read mapping illustrates a strong increase of transcripts for the ‘early genes’ whereas ‘late genes’ are poorly expressed under both conditions.

