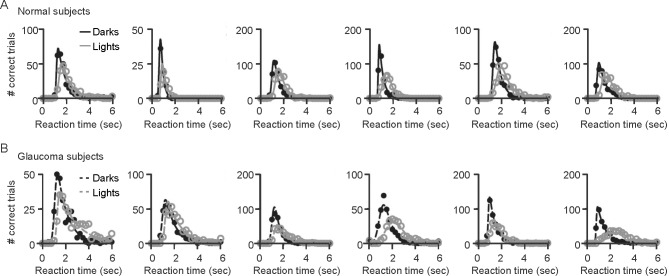
Figure 2.
Observer performance. Observer's performances were evaluated by plotting the number of correct trials as a function of reaction time, when the targets to be detected were dark (dark circles and lines) or light (gray circles and lines). (A, B) In both groups of observers, those with normal vision (A) and those with glaucoma (B), the responses were faster and the number of correct trials higher for dark than light targets.

