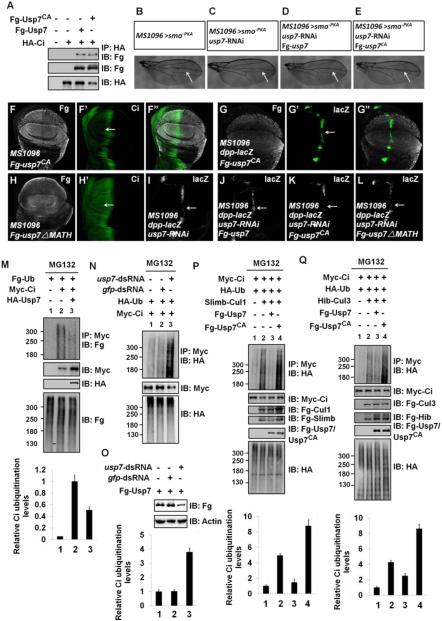
Figure 4. Usp7 Attenuates Slimb-Cul1- and Hib-Cul3-mediated Ci Ubiquitination through Its Deubiquitinating Activity.
(A) Both Fg-Usp7 and Fg-Usp7CA could bind Myc-Ci in S2 cells.
(B-E) Comparison of adult wing phenotypes from control flies (B), usp7 knockdown (C), Fg-usp7 expression in usp7 knockdown background (D), Fg-usp7CA expression in usp7 knockdown background (E). Arrows marked the space between vein3 and vein4.
(F-F”) A wing disc expressing usp7CA with MS1096 was immunostained to show Fg tag (white) and Ci (green). Ci level was not upregulated by usp7CA expression (arrow).
(G-G”) A wing disc expressing usp7CA with MS1096 was stained for Fg tag (white) and dpp-lacZ (green). usp7CA overexpression decreased dpp-lacZ expression (arrow).
(H-H’) A wing disc expressing usp7-ΔMATH with MS1096 was stained with Fg tag (white) and Ci (green) antibodies. Ci level was not altered by usp7-ΔMATH expression (arrow).
(I-L) Wing discs expressing usp7 RNAi (I), Fg-usp7/usp7 RNAi (J), Fg-usp7CA/usp7 RNAi (K) or Fg-usp7-ΔMATH/usp7 RNAi (L) were stained for dpp-lacZ expression (white). The attenuation of dpp-lacZ caused by usp7 knockdown (I, arrow) could be restored by the expression of Fg-usp7 (J, arrow), but not Fg-usp7CA (K, arrow) and Fg-usp7-ΔMATH (L, arrow).
(M) Western blots of immunoprecipitates (top) or lysates (bottom three panels) from S2 cells expressing indicated proteins and treated with MG132.
(N) Knockdown of usp7 using usp7-dsRNA promoted Ci ubiquitination in S2 cells.
(O) usp7-dsRNA could effectively knock down Fg-usp7 expression in S2 cells. Actin acts as a loading control.
(P-Q) Transfected S2 cells were treated with MG132 for 4hrs before cell harvesting. Fg-Usp7 decreased, but Fg-Usp7CA promoted Ci ubiquitination mediated by Slimb-Cul1 (P) and Hib-Cul3 (Q). From M-Q, quantification analyses of the ubiquitination levels of Ci were shown below each autoradiogram. Data are means±SD from three independent experiments.

