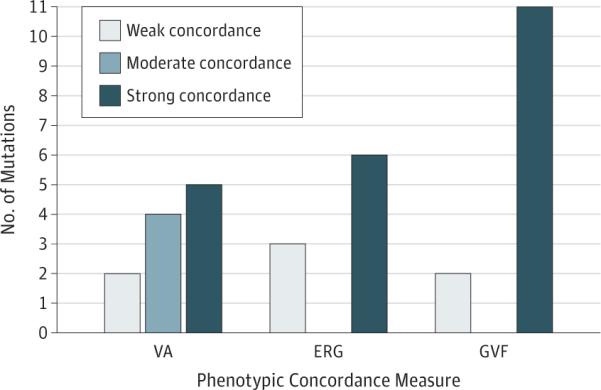
Figure 4. Summary of Phenotypic Concordance in Visual Acuity (VA), Electroretinography (ERG), and Goldmann Visual Field (GVF) Data.

Numbers of mutations exhibiting strong, moderate, or weak concordance for each modality are shown. Phenotypic concordance was highest when assessed by comparing GVF phenotypes between patients.
