Figure 5.

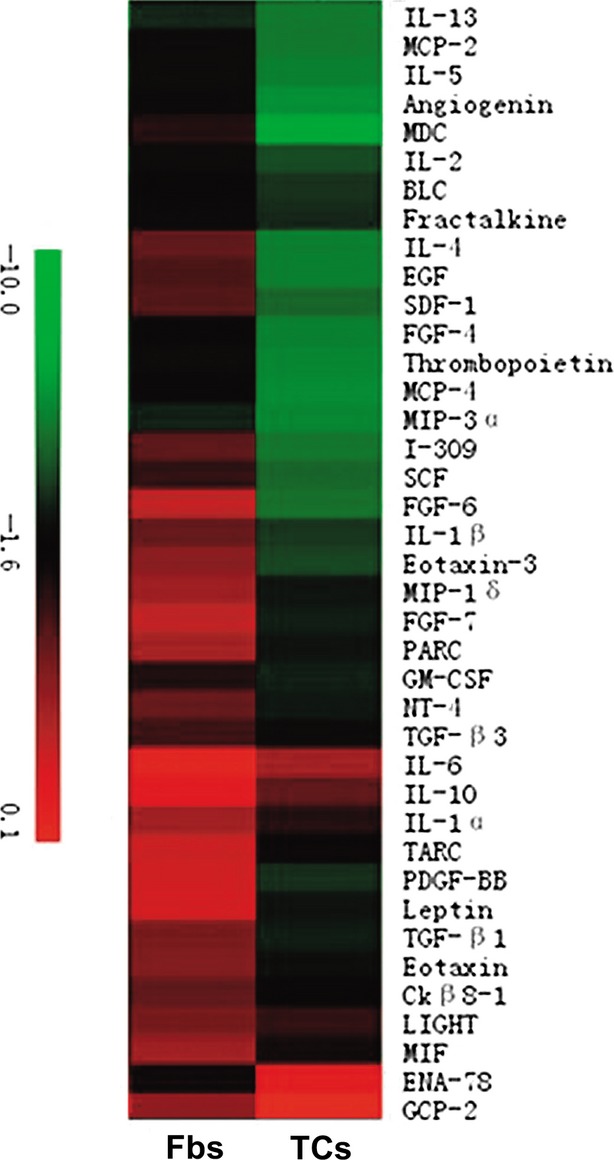
Hierarchical cluster analysis of the differentially expressed cytokines among telocytes (TCs) and fibroblasts (Fbs). The different colour represents relative expressions of different cytokines.

Hierarchical cluster analysis of the differentially expressed cytokines among telocytes (TCs) and fibroblasts (Fbs). The different colour represents relative expressions of different cytokines.