Figure 1.

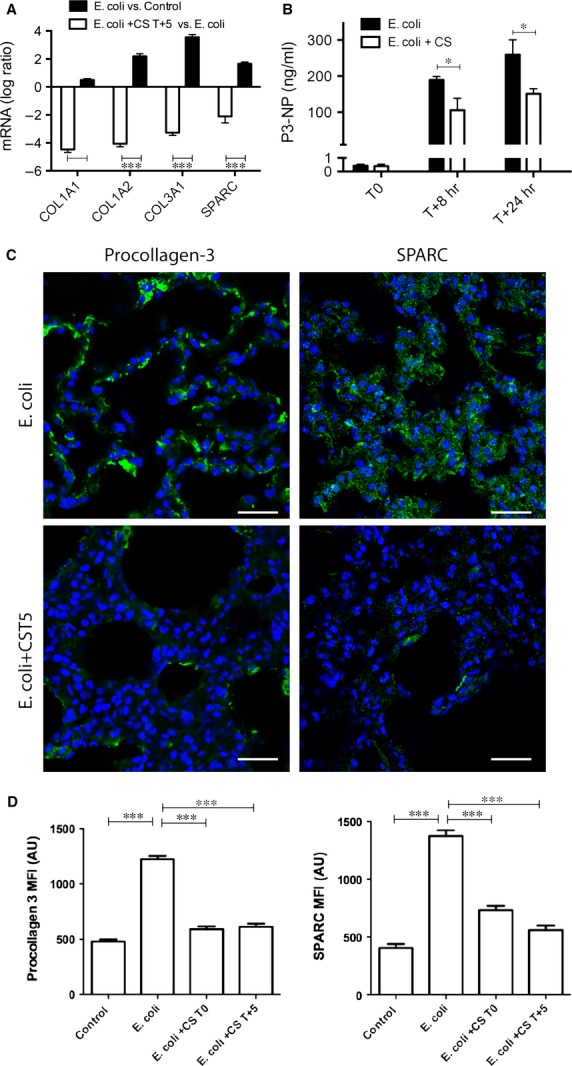
Compstatin treatment decreases sepsis-induced fibrosis of the lung. (A) Log ratio representation of qPCR analysis of three collagens and SPARC mRNA in sepsis versus healthy control and sepsis versus compstatin treated at T+5 hrs (Escherichia coli +CS T+5) animal groups. Expression values were normalized by housekeeping gene β-actin. Data are shown as mean ± S.E.M.; three replicates per experimental condition with unpaired two-tailed t-tests; ***P < 0.001. (B) Time-course of procollagen-3 N-terminal peptide (P3-NT) levels in plasma of baboons challenged with E. coli, with/without compstatin treatment at T+5. Data are shown as mean ± S.E.M.; *P < 0.05, n = 3. (C) Microscopic imaging and semi-quantitative analysis of staining intensity in lung tissue stained for matrix proteins and complement pathway proteins. The micrograph panel shows (in columns) immunostaining for procollagen 3 and SPARC (osteonectin) (in rows) in septic baboons (E. coli), and septic baboons treated with compstatin during the second (E. coli +CS T+5) stage of sepsis. Nuclear staining (blue) facilitates recognition of microscopic structures. Magnification: bar, 50 μm. (D) Histogram representation of mean fluorescence intensity (MFI) for procollagen-3 and SPARC. In addition to the image series shown above, all quantitative image analysis includes data obtained from healthy controls and compstatin treatment during the first stage of sepsis (E. coli +CS T0). Data are shown as means ± S.E.M. of at least 10 images for each experiment. One-way anova with Dunnett's multicomparison test; ***P < 0.001 as compared to the E. coli group.
