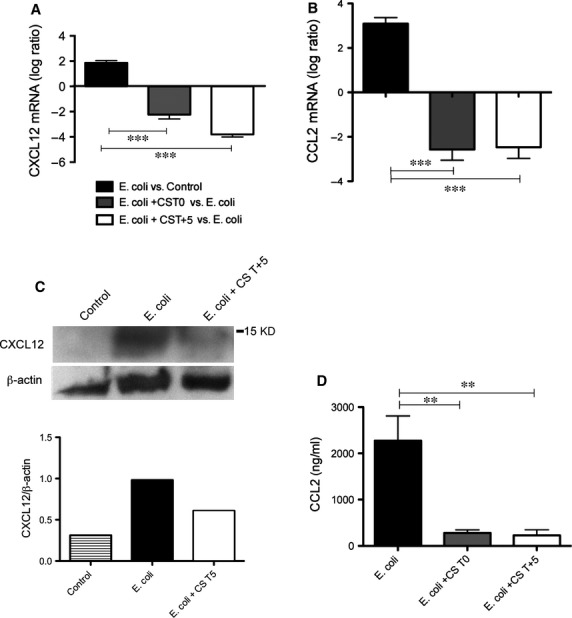
Figure 3.

Compstatin treatment decreases sepsis-induced fibrogenic cytokines. (A) Log ratio representation of qPCR analysis of CXCL12 mRNA transcripts in Escherichia coli versus healthy controls and animals treated with compstatin at T0 or T+5, versus untreated septic animals. Data are shown as mean ± S.E.M. of three replicates. One-way anova with Dunnett's multicomparison test; ***P < 0.001 as compared to E. coli versus Control ratio. (B) CCL2 mRNA levels, determined by qPCR. Data are shown as mean ± S.E.M. of three replicates. One-way anova with Dunnett's multicomparison test; ***P < 0.001 as compared to E. coli versus Control ratio. (C) Immunoblot and densitometry of CXCL12 in lung homogenates from control, septic (E. coli), and compstatin-treated (E. coli +CS T+5) baboons. β-actin was used for normalization. Representative data of three replicates are shown. (D) CCL2 levels, determined by ELISA in plasma collected 24 hrs post-challenge from E. coli sepsis and compstatin treatment groups. Data are shown as mean ± S.E.M. of three replicates. One-way anova with Dunnett's multicomparison test; **P < 0.01 as compared to E. coli group.
