Figure 5.

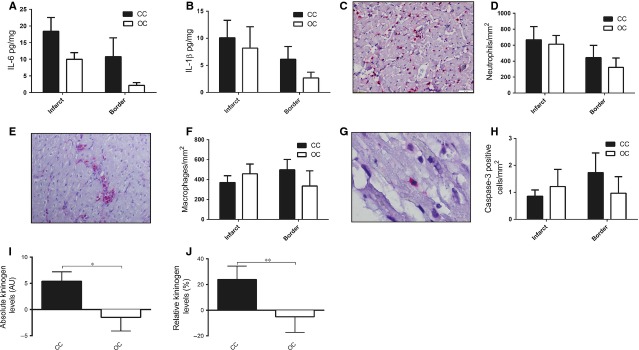
Local markers of the inflammatory response were measured in the myocardium. (A) Myocardial IL-6 content corrected for protein concentration in both the border and infarct zone differed non-significantly between the open chest and closed chest group. (B) Myocardial IL-1β content corrected for protein concentration in both the border and infarct zone differed non-significantly between the open chest and closed chest group. (C) Representative picture of histological section of infarcted myocardial tissue containing neutrophils (red cells) 72 hrs post-reperfusion. (D) Neutrophil numbers in both the border and infarcted zone of the myocardium are similar between the open chest and closed chest group. (E) Representative picture of macrophages (red) resided in the infarcted myocardium. (F) Macrophage numbers in both the border and infarcted zone of the myocardium are similar between the open chest and closed group. (G) Representative picture of an active caspase-3 positive cell (red). (H) Apoptosis of myocardial cells was similar between open chest and closed chest pigs. (I and J) Absolute and relative kininogen levels are higher in the closed chest compared to the open chest group. pg: picogram; mg: milligram; AU: arbitrary units; CC: closed chest; OC: open chest, *P < 0.05, **0.05 < P < 0.1.
