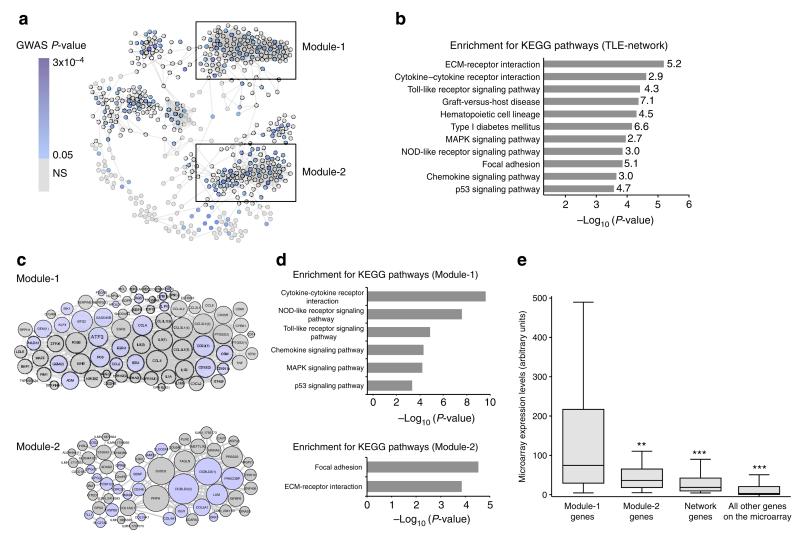
Figure 1. Identification of the TLE-network and functionally specialized transcriptional modules in human epileptic hippocampus.
(a) Gene co-expression network identified in the hippocampus of TLE patients (TLE-network). Nodes represent genes and edges represent significant partial correlations between their expression profiles (FDR<5%). Node colour indicates the best GWAS P-value of association with focal epilepsy for SNPs within 100 kb of each gene (Supplementary Data 1). Boxes mark two transcriptional modules within the network. (b) Kyoto Encyclopedia of Genes and Genome (KEGG) pathways significantly enriched in the TLE-network (FDR<5%). The fold enrichment for each KEGG pathway is reported on the side of each bar. (c) Module-1 and Module-2 details. The size of each node is proportional to its degree of interconnectivity within each module. Light blue indicates genes showing nominal association with susceptibility to focal epilepsy by GWAS. Numbers in parenthesis indicate multiple microarray probes representing the same gene. (d) KEGG pathways significantly enriched in Module-1 (top) and Module-2 (bottom; FDR<5%). (e) Module-1 is significantly highly expressed in the hippocampus of TLE patients. mRNA expression of Module-1 (n = 80 probes, representing 69 unique annotated genes) as compared with Module-2 (n = 60 probes, representing 54 unique annotated genes), other network genes (n = 371 probes, representing 319 unique annotated genes) and all other probes represented on the microarray (n = 48,256). **P = 3.8 × 10⁻⁴; ***P < 10−10, Mann–Whitney test, two-tailed.

