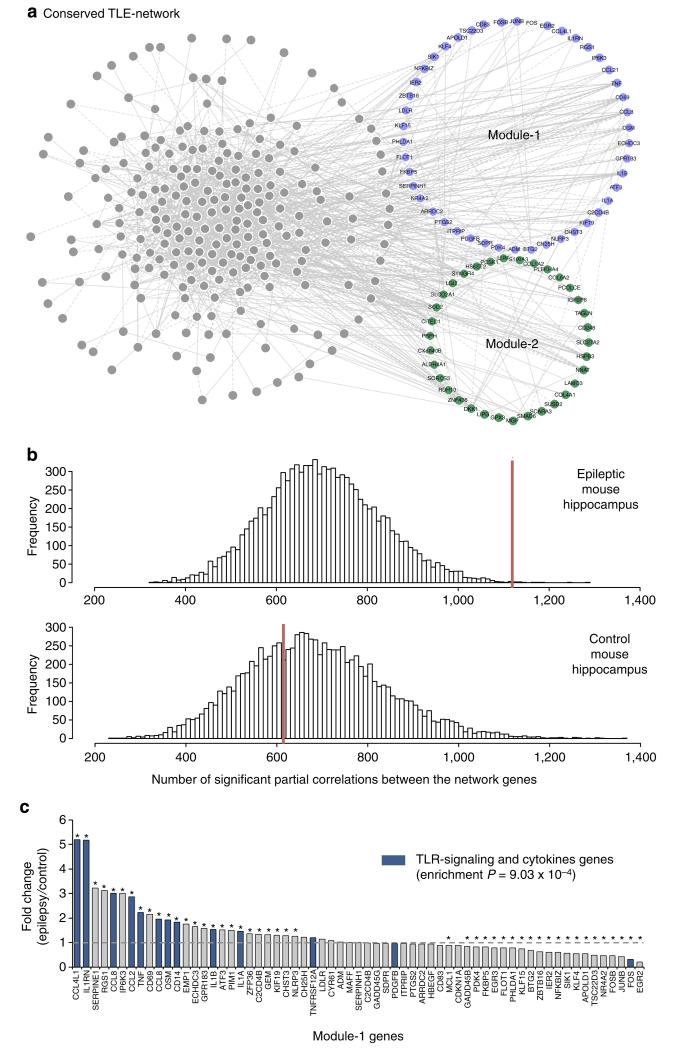
Figure 2. TLE-network conservation in mouse epileptic hippocampus.
(a) Human TLE-network genes that are conserved and co-expressed (84%) in the mouse hippocampus. Each node in the network represents a transcript that had significant partial correlation with at least another transcript in the network (FDR<5%). Conserved Module-1 and Module-2 genes are indicated in blue and green, respectively. (b) Distribution of significant partial correlations (FDR<5%) between pairs of transcripts from 10,000 bootstrap permutation samples in epileptic (top) and control (bottom) mouse hippocampus. In each case, the red line indicates the actual number of significant partial correlations (FDR<5%) between all genes in the network. The number of significant partial correlations observed in control hippocampus was no different from chance expectation (P = 0.659). In contrast, the number of significant partial correlations detected in epileptic hippocampus was significantly higher than expected by chance (P = 0.001). (c) Differential expression of Module-1 genes between control and epileptic mouse hippocampus shows specific enrichment for TLR-signalling and cytokine genes among the upregulated genes (gene set enrichment analysis28). Stars denote significant fold changes between epileptic and control mouse hippocampus (FDR<5%); blue bars indicate TLR-signalling and cytokine genes.

