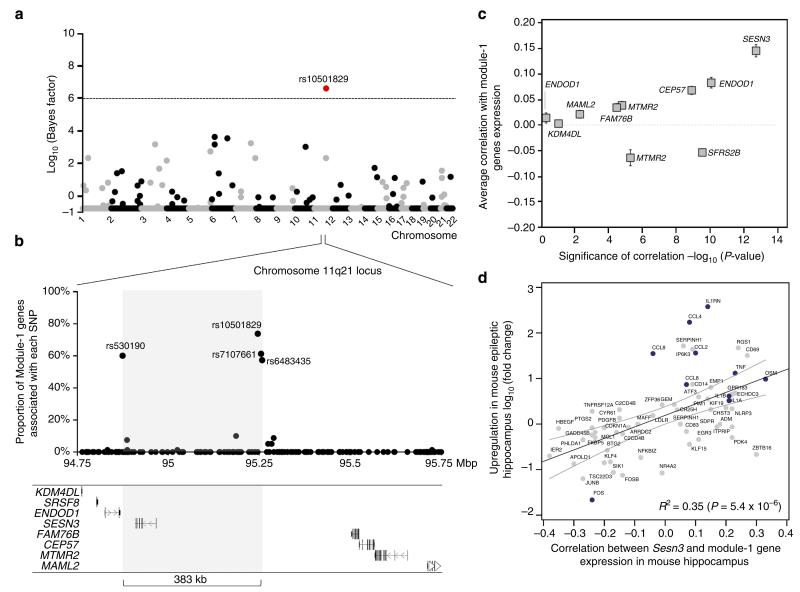
Figure 3. SESN3 is a trans-acting genetic regulator of Module-1 in epileptic hippocampus.
(a) Genome-wide mapping of the genetic regulation of Module-1. For each autosome (horizontal axis), the strength of evidence for each SNP (filled dot) being a regulatory locus for the first PC of Module-1 expression is measured by the log10(Bayes factor) (vertical axis). The Bayes factor quantifies evidence in favour of genetic regulation versus no genetic control of module expression, and is reported as a ratio between the strengths of these models. At 5% FDR (that is, log10(Bayes factor)>6, dashed line), SNP rs10501829 (11q21, highlighted in red) was significantly correlated with Module-1 expression. (b) Joint mRNA levels and SNPs analysis within the 1-Mbp region centred on SNP rs10501829, comprising 178 SNPs genotyped in the TLE patient cohort. We carried out multivariate Bayesian regression modelling18 of all Module-1 probes (n = 80) and all SNPs (n = 178) to identify the most informative SNPs in the region predicting Module-1 expression. For each SNP, we report the proportion of associated genes in Module-1 (vertical axes): four SNPs (rs10501829, rs530190, rs7107661 and rs6483435) that are individually associated with 58–74% of Module-1 genes are highlighted. The grey box indicates the boundaries of the associated regulatory region (delimited by SNPs rs530190 and rs6483435), spanning 383 kb. (c) For each candidate gene at the 1-Mbp regulatory locus, we report the average Pearson correlation (r; ± s.e.m.) between the candidate gene’s expression and the expression of Module-1 genes (y axes) and its statistical significance for deviation from r = 0 (x axes). Two-tailed P-values are reported on a negative log scale and were calculated using one sample Wilcoxon Signed Rank test. Two genes (ENDOD1 and MTMR2) were represented by two microarray probes and were analysed separately. (d) Association between increased Sesn3 mRNA expression and upregulation of Module-1 genes in epileptic mouse hippocampus. For each gene, we report its log10(fold change) in epilepsy versus control (y axes) and its correlation with Sesn3 mRNA expression (x axes). The 95% confidence interval of the slope of the regression line is indicated. TLR-signalling and cytokines genes are highlighted in blue.

